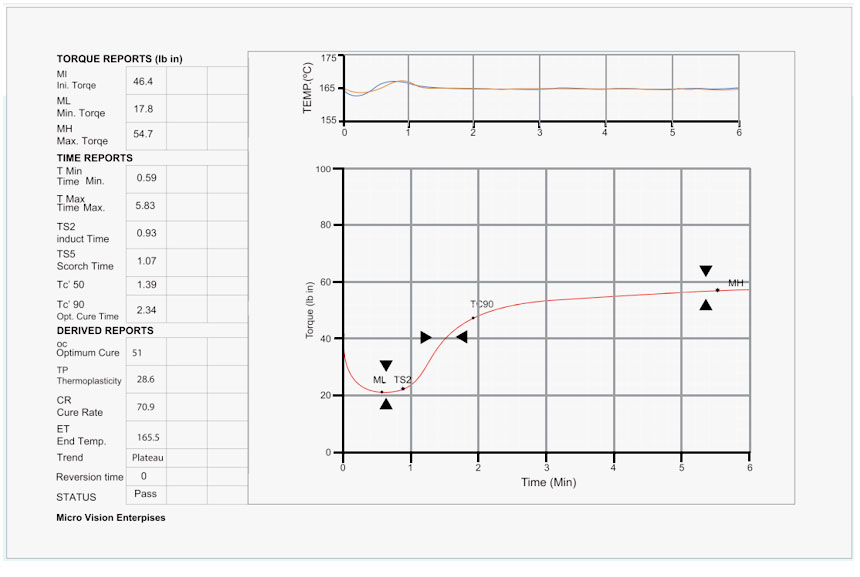
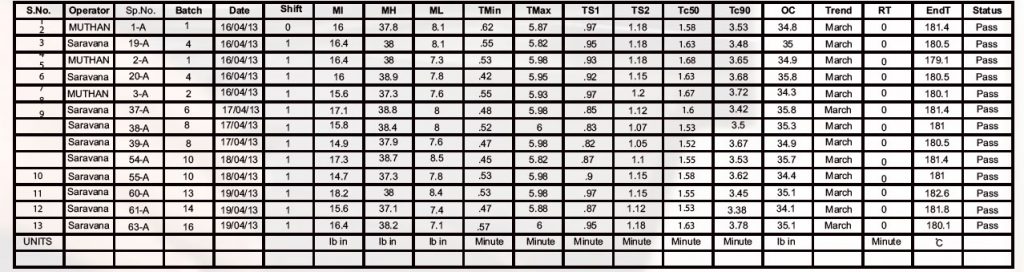
Oscillating Disc Rheometer shows a typical Cure Curve obtained in the software test screen. The curve of Torque V/s Cure Time depicts all the vulcanization characteristics of the Rubber Compound and that can be determined directly. XY Plot of Torque (F) against real cure time is called Rheometer graph. Rheometer graph is displayed in real time and at the end of test time, software and displayed on the screen.
Principle
In the context of Rheometer, the cross linking Isotherm is thus the function of time, of the oscillating shear force B. or of the Rheometer indicating proportionality to it – occurring at a given temperature as a result of vulcanization. A plot of this torque (F) value against time gives a typical graph called “Cure Curve or Rheo graph. A trained eye can monitor the Initial trough le. processing behavior of the compound; the slope of rise during cure phase i.e., curing characteristics and the final shape of the curve on Internationally designated parameters like MI,ML.MH, Ts2, TC.50,TC90 etc.
Results:
When ?
A complete Cure Curve is obtained when the recorded torque value ether increases to an equilibrium value or the maximum value
How ?
The time required to obtain a Cure Curve 18 a function of the test temperature and the vulcanization characteristics of the specimen
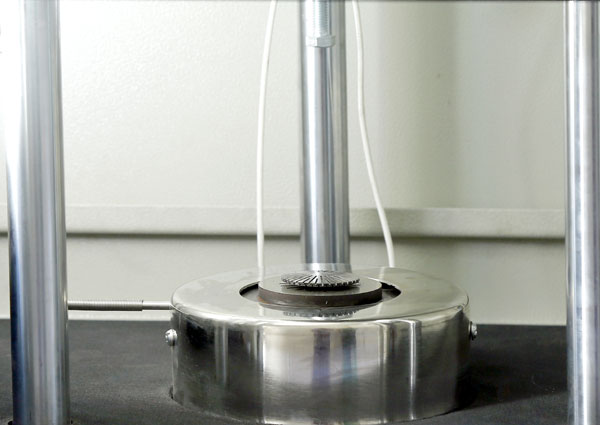
Rubber compound/The signal of torque (F) 18 sensed by a torque sensor mounted directly on the torque shalt bearing the rotor under stress The torque sensor then, converted to volts and travels. through ADC fed into the computer to draw torque against time curve called Rheo graph. The computer then, calculates the measurements on its own.
Reversion Time
The minimum torque la proportioned to the viscosity of the uncured compound. The scorch, time is a measure of process safety. The full curved torque is a measure of shear modulus or stillness of the compound.
Reversion Time In-depth Understanding of Rheo graph
and Computed Values RHEOGRAPH
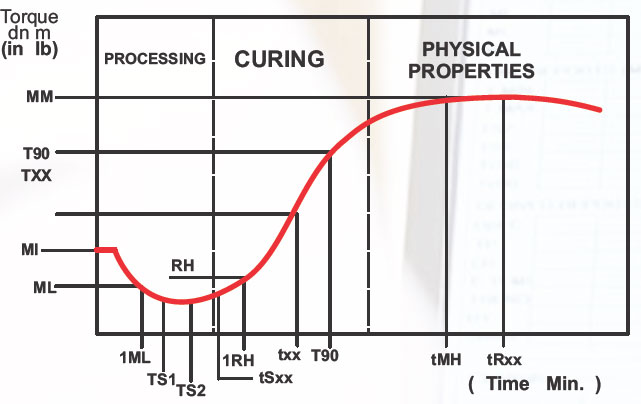
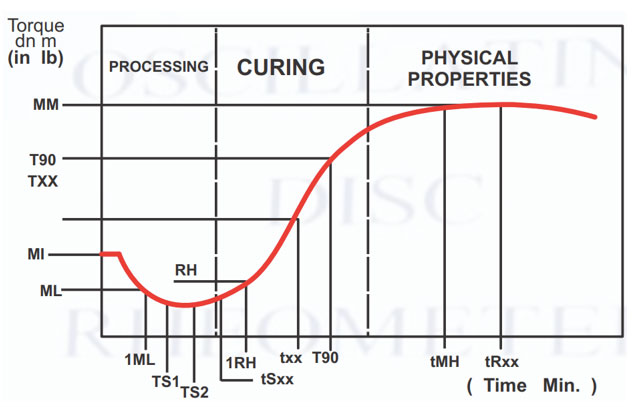
The diagram above shows a typical Cure Curve obtained with an Oscillating Disc Rheometer . The curve of Torque V/s Cure Time depicts all the vulcanization characteristics of the Rubber Compound and that can be determined directly. XY Plot of Torque (F) against real cure time is called Rheo graph.
Thereafter, Rheograph is divided into three phases that describe the rubber compound
Phase 1 – Indication of processing behavior Phase 2 – Describes the curing characteristics Phase 3 – Describes physical properties
Results & Values
The plot of torque against time is analyzed to obtain the various results. In the Oscillating Disc Rheomoter, the Rheo graph is displayed in real time and at the end of test time, computer analyses the graph and results are automatically then, computed and displayed on the screen.
The results are then, categorized into three columns of which the significance is described further
Torque & Value
MI (Initial Torque) – It is the torque recorded at zero time.
ML (Minimum Torque) – As the compound gets heated under pressure, the viscosity decreases and the torque falls. The lowest value of Torque recorded is called ML, which is a measure of the stiffness and viscosity of un vulcanized compound.
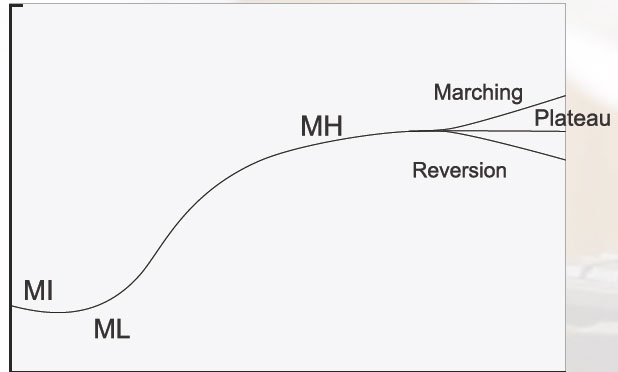
MH (Maximum Torque): As the curing starts, the torque increases proportionately. Depending upon the type of compound, the slope of rising torque varies. The torque then, attains maximum value which is displayed through Plateau Curve. If the test is carried out for enough time, the reversion of cure occurs and torque tends to fall.
This type of curve with reversion is called Reverting Curve.
At times, the torque shows continuous rising trend during the period of record and the curve is called Rising or Marching Curve.
Time Value
TSS (Scorch time) – It is the time for viscosity (torque) to rise 5 units above ML. Both ts2 and ts5 are measures of initial slope of curing phase of Rheograph i.e., these are the measures of processing safety. Scorch is premature vulcanization in which the stock becomes partially vulcanized before it is in its final form and ready for vulcanization. It reduces the plastic properties of the compound so that it can no longer be processed. Scorching is the result of both – when the temperatures reach maximum during processing and the amount of time the compound is exposed to elevated temperatures. This period is generally referred to as Scorchtime
Since scorching ruins the stock, it is important that vulcanization does not start until processing is complete.
TS2 (Induction sime) After attaining minimum torque, during cure phase, as the torque rises, ts2 is scorch time for viscosity vlorise2 un its above Ml
TS50 (Optimum Cure Time) – It is the time at which 50 per cent of cure has already taken place
TS90 (Optimum Cure Time) – It is the time at which 90 per cent of curehas takenplace.
ADVANTAGES
What makes MV Rheometer special ?
We all know the fact that the effects of compound variations on curing characteristics are important in compound development studies and production control. la-compound development and the composition of ingredients can vary until The desired vulcanization characteristics are achieved
‘Therefore, computerized Rheometer
will micro- processor temperature controls is of vital importance here.
And, the Rheometer is the one and only equipment in the Rubber Industry which helps the Compounder to choose the right material and meet the requirements of the product to its end. It not only exhibits the curing characteristics of Rubber Compound but it also monitors the processing characteristics as well as the physical properties of the material
Let's look into the benefits of the Cure Curve
A) Research & Development
To develop a new compound, Rheometer helps
Defining compound’s quality targets
Designing preliminary compounds that includes selecting specific ingredients and determining each ingredient’s quantity,
Costing
Individual Testing
Redesigning the formula till the required quality target is achieved
Helps reducing the time taken to process and minimum wastage
B) QUALITY CONTROL
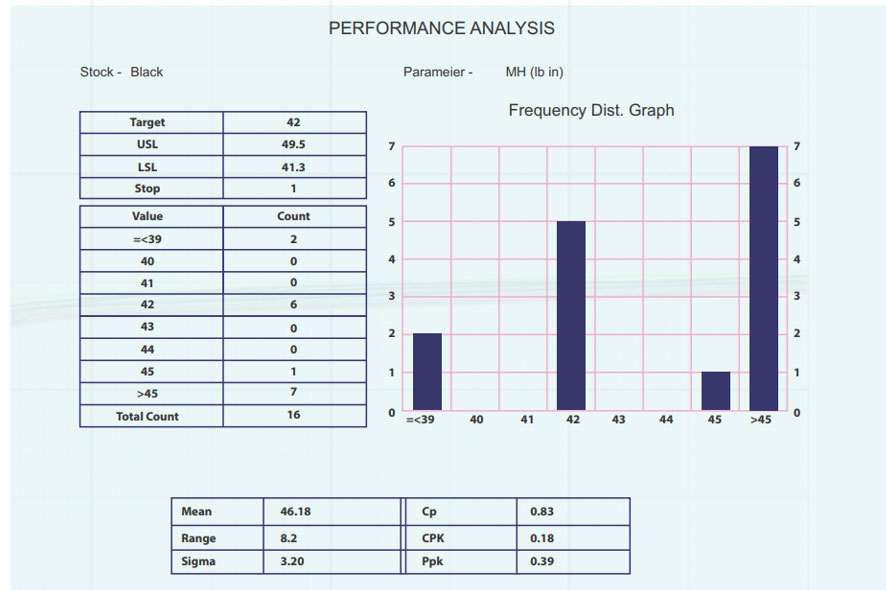
Rheometer is based on internationally recognized “Statistical Quality Control” (SQ0). I is of utmost importance to produce consistent quality of Rubber products and one cannot afford variation in batches, Geometric analysis helps
C) Process Control
MV Rheometer is widely accepted Production Control Test Equipment. It helps getting the exact and accurate processing behavior of the compound. MV Rheometer can detect the minutest of changes in the composition of rubber
Effect of new Ingredients
MV Rheometer has proven to be useful to study changes in the compound and is used to study that effect.
Ingredient Optimisation
The Rheometer can determine it there is any: change required or done in the quantity of ingredients in the compound.
Assessment of Physical Properties
MV Rheometer can also determine the physical properties of the compound.
Economics
Everything said, but one may still be hesitant in investing in such instruments mainly because of its cost. Experience has shown that if Rheometer’s full potential is exploited with regards to few of various advantages mentioned above, the return is quite handsome. Improved quality, minimized wastage, optimized dosage of each ingredient, choice of right ingredients, controlled process certainly makes this instrument singularly ideal for
Curve Segment &
Cure Curve Types
Curve Segment
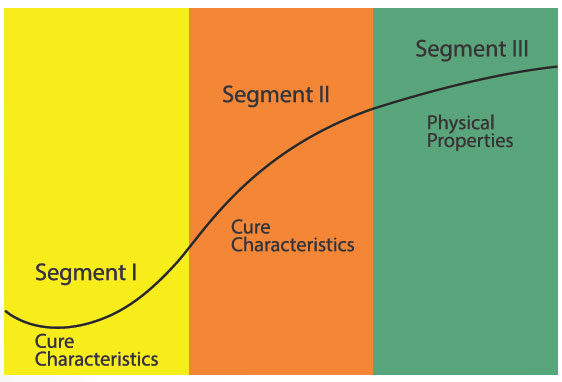
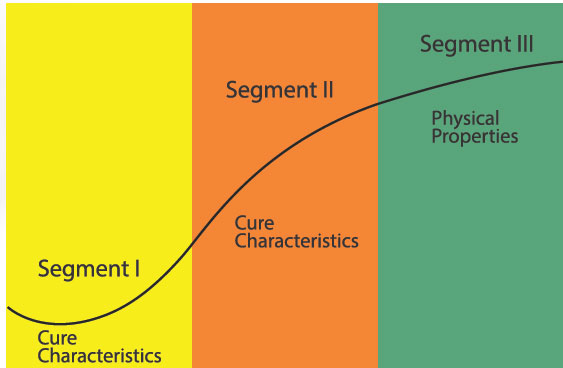
Typically, the cure curve us shown in the fig can be divided into three segments
For segments I – It to gives the information related to the processing characteristics such as the viscosity and the fluidness.
For segments Ll – It shows the characteristics of the curing rate
For segment Ill – It indicates the physical properties such as stiffness, hardness, strength.
Cure Curve Types &
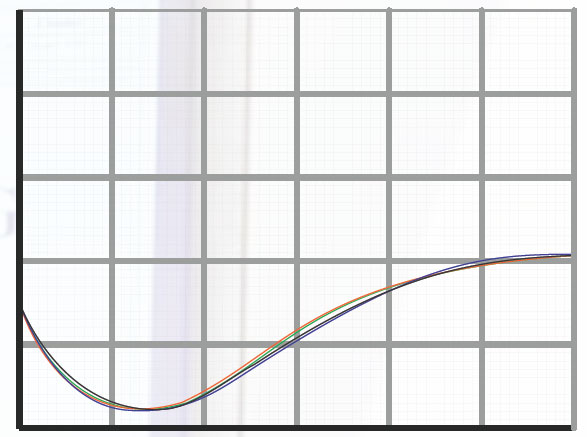
As shown in the following picture according to the deterrence of rubber compounds, the cure curve are classified typically in three types.
Vulcanization to equilibrium torque.
Vulcanization to a maximum torque with reversion.
3. Vulcanization with continuously increasing torque
Results Obtained
with Rheometer
The Processing Curve
During which the viscous (plastic) behavior of the compound is dominating shows rubber process ability and therefore furnish useful indications about the fluency in the moulds.
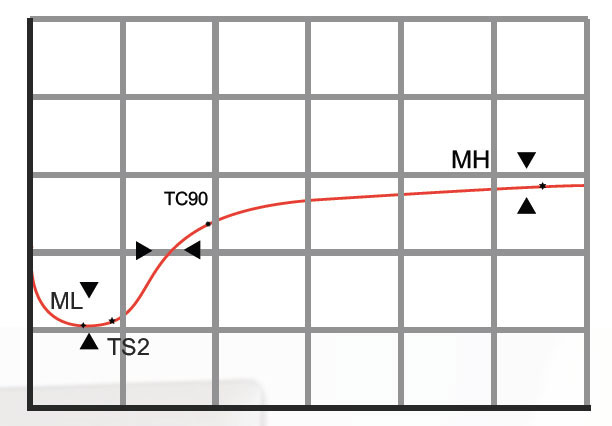
Meaningful results are :ML, (least torque)
151, 152: Scorch time: time required for the increase of 1 (ts1) or 2 (ts2) points from Minimum Torque. This number is an indication of the use required for the beginning of the process of cross linking.
'The Curing Phase
During the curing phase of the curve, the cross-linking process evolutes. ‘The shape and the slope of the curve are very important because the curing curve must be designed according to the thickness of the finished part to produce and to the kind of transformation process
Typical data chat can be obtained from the curve are:
¿10: time corresponding to 10% curing
150: time corresponding to 50% curing
190: lime corresponding to 90% curing
“This result is considered the ‘optimum vulcanization line
Note: More data about the slope of the curve can be oblained.
The Physical Properties Phase
‘The last part of the curve is an indication of the physical proprieties of the compound.
‘The maximum value of torque obtained is related
with:
– the final level of cross-linking.
“The quality of the polymer used
“The filler used
The compounding process.
“The typical result is: MH: Maximum Torque
Alter the Maximum Torque has been reached the degradation of the compound can be measured.
The reversion is an indication of the resistance ofthe compound at high temperature and can be usefulforthedesign of the transformation process