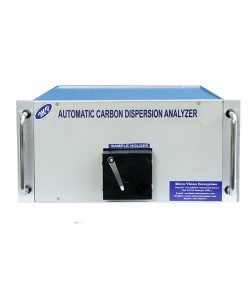


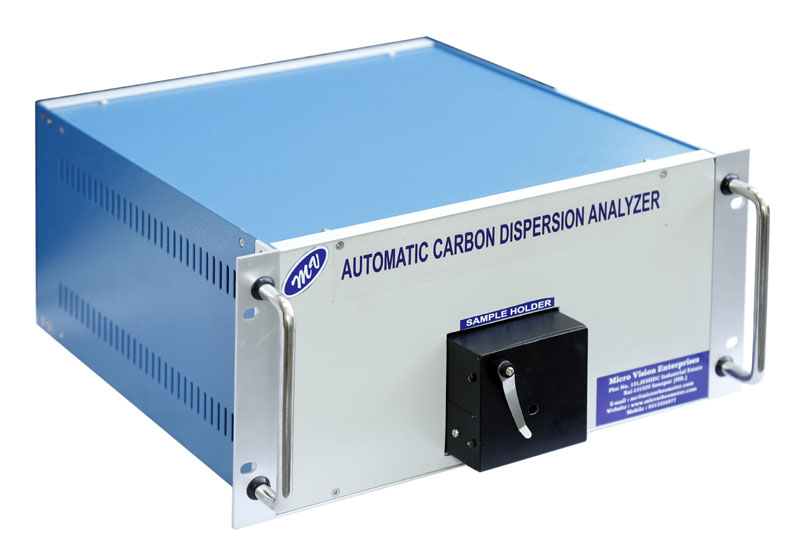
The New Millennium brings new challenges and new parameter this to meet the same, accurate testing methods have become an essential prerequisite to meet the enhanced quality challenges. Micro vision Enterprises presents you the DISPERSION ANALYZER. The internationally accepted technology is totally computerized controlled and is the only one of its kind in the rubber industries which helps you to identify the perfect mix of material and doze to suit the end product and its parameter .Since Dispersion of Carbon black in rubber is directly related to quality, it is important that the best possible dispersion be obtained. Agglomerates of black in the range of 10 mm or greater are of the most damaging. A visual photograph can easily pickup this poor dispersion of black in the compound.
Principle
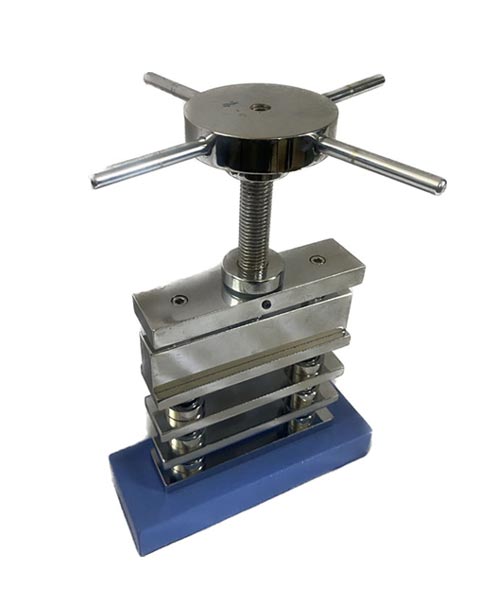
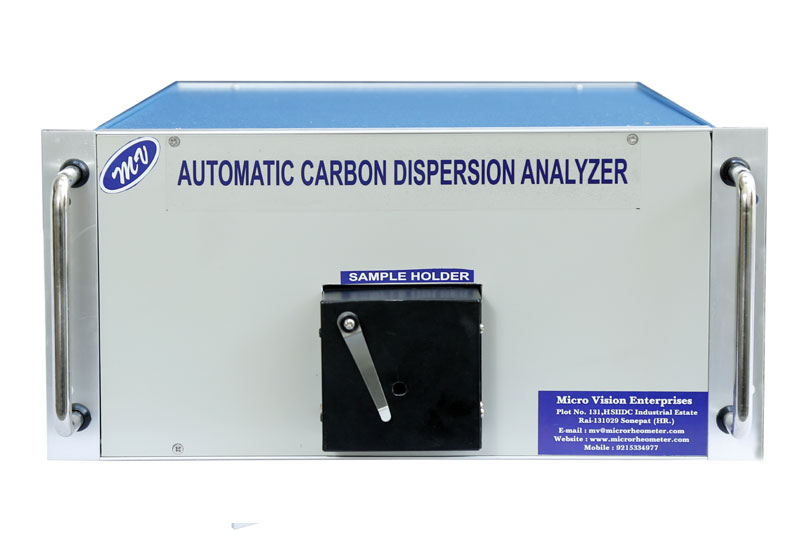
A test piece of approximately 30×15×2mm out of a 2mm thick rubber slab is cut with the help of a sample cutter provided with the system. This sample is mounted on the sample-holder and positioned under the microscope for inspection.
To achieve a magnification of 30x a Japanese CCD
Camera with lenses is provided with the system.
The photograph is captured by the customized software supplied along with the system. In the software, the standard photographs for Comparison with the sample are also available to make a quick decision of the rating of the dispersion.
Specification
| Standard Reference | ISO 11345 |
| Sample Cutter | Provided with spare blades |
| Focus setting | Automatic |
| Computerized Dispersion Rating | Dispersion Classification |
| 9-10 7-8 5-6 3-4 1-2 | Excellent Good Acceptable Poor Very Poor |
| Weight (Approx) | 15kg |
| Magnification Interface | 30x |
| Power Requirements | 240, 50Hz |
Put the specimen on the measuring platform. By using 45°light to illuminate the specimen and to enlarge the captured image displayed along with reference standard image
Reports
The Dispersion Analyzer performs “Statical Analysis of result” and can represent the data in graphical from if controlling with in set limits.